main logo

chuuk Maps: water

Hydrography

Streams and rivers

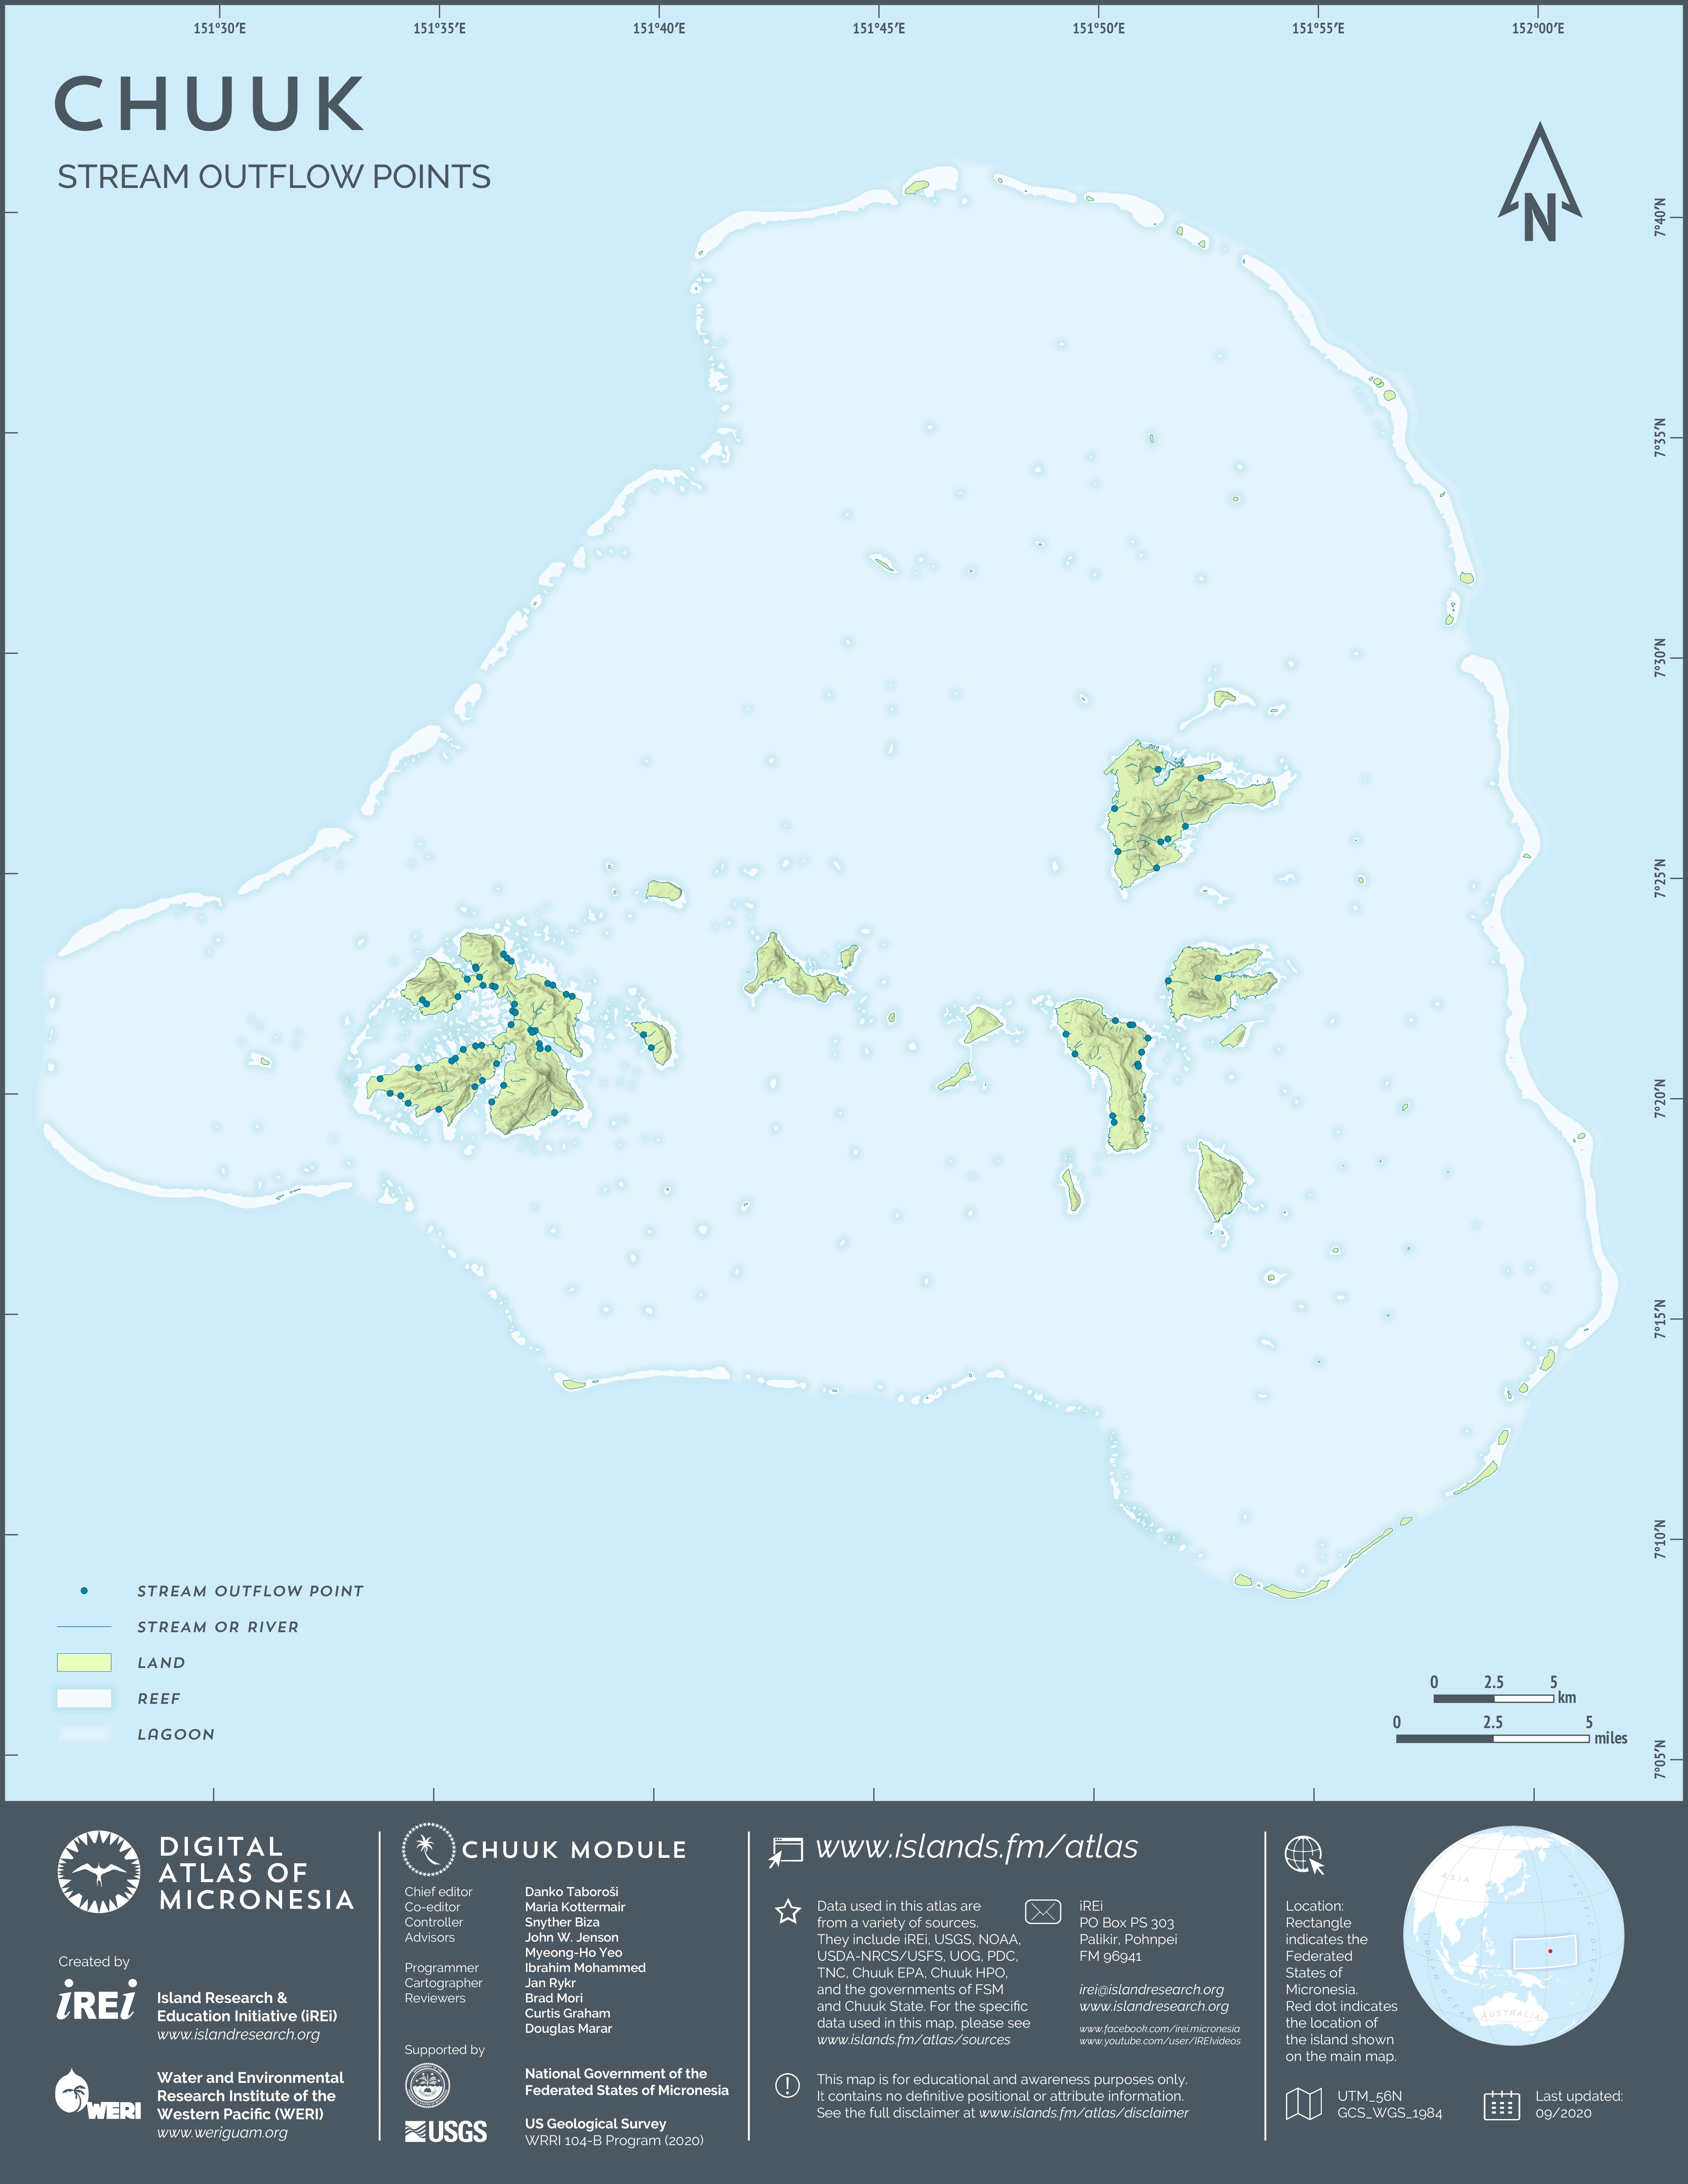
Streams and rivers [USGS version]

This map shows the rivers and streams on the islands in Chuuk Lagoon as represented on the U.S. Geological Survey (USGS) 1:25,000-scale topographic maps (1996-1997). The dataset was extracted from the Digital Line Graphs (DLGs) from USGS and names from the Geographic Names Information System (GNIS) by Island Research & Education Initiative (iREi) (2020) and slightly modified to match the new base layer.

Natural outflow points

This map shows the natural outflow locations on the islands in Chuuk Lagoon, defined as points where streams and rivers discharge into the lagoon. The dataset was created by Island Research & Education Initiative (iREi) (2020) by identifying the points where streams and rivers from 1:25,000-scale U.S. Geological Survey (USGS) topographic maps (1996-1997) intersect with the most recent shoreline of Chuuk. Please note that the points are somewhat arbitrary and approximate because many streams discharge into mangrove areas rather than directly into the lagoon and lack particular channels or single outflow locations.

Waterfalls

This map shows the locations of waterfalls on the islands in Chuuk Lagoon. The data layer was created by Island Research & Education Initiative (iREi) (2020), using field observations and information provided as KML files by Nely Mori Ruben (Chuuk Visitor's Bureau).

Modeled streamflow

Flow paths

This map shows the theoretical drainage pattern on the islands in Chuuk Lagoon. The flow paths were delineated by Island Research & Education Initiative (iREi) (2020). This was done by Maria Kottermair through hydrological modeling using a 10-meter Digital Elevation Model (DEM) created by U.S. Geological Survey (USGS) based on topography compiled in 1968. Note that in very flat low-lying areas the data may indicate straight lines that are an artifact of the modeling process and do not reflect reality.

Flow accumulation

This map shows the flow accumulation on the islands in Chuuk Lagoon. Flow accumulation describes the amount of water in streams. The higher the value, the more water a particular location receives from areas uphill. The dataset was created by Island Research & Education Initiative (iREi) (2020). This was done by Maria Kottermair through hydrological modeling using a 10-meter Digital Elevation Model (DEM) created by U.S. Geological Survey (USGS) based on topography compiled in 1968. Note that in very flat low-lying areas the data may indicate straight lines that are an artifact of the modeling process and do not reflect reality.

Modeled drainage basins

Principal watersheds

This map shows the principal watersheds (drainage basins) on the islands in Chuuk Lagoon. The dataset was created by Island Research & Education Initiative (iREi) (2020). Basin boundaries were delineated by Maria Kottermair through hydrological modeling using a 10-meter Digital Elevation Model (DEM) created by U.S. Geological Survey (USGS) based on topography compiled in 1968. Note that basin boundaries shown are modeled and, as such, reflect the DEM and not necessarily actual situation on the ground. The watershed boundaries may differ from actual management units, especially as smaller basins were sometimes merged to a ‘principal’ watershed to avoid too many small remnant basins.

Sub-watersheds

This map shows the principal watersheds (drainage basins) and their sub-watersheds on the islands in Chuuk Lagoon. The dataset was created by Island Research & Education Initiative (iREi) (2020). All boundaries were delineated by Maria Kottermair through hydrological modeling using a 10-meter Digital Elevation Model (DEM) created by U.S. Geological Survey (USGS) based on topography compiled in 1968. Note that apparently unnatural boundaries such as series of straight, parallel lines are artifacts of modeling and do not reflect reality.

Water resources

Water resources

Freshwater sources [springs and shallow wells]

This map shows the locations of the freshwater sources recorded on the topographic map of Chuuk, 1:25,000 scale, published by the U.S. Geological Survey (USGS) in 2001. The dataset distinguishes between springs and wells, as shown on the original map. The wells are mostly shallow, dug wells, but may also include deeper, drilled wells on Weno and other islands. The data layer was created by Island Research & Education Initiative (iREi) (2020) by manually digitizing features from the USGS topographic map. The locations are approximate and may include features that no longer exist. It should be noted that Chuuk Lagoon has no karst terrain on high islands, so all groundwater there issues from volcanic aquifers.

Weather and climate

Monitoring

Gaging stations

This map shows the locations of the U.S. Geological Survey (USGS) gaging stations on Weno and Tonoas islands. The dataset was extracted by Island Research & Education Initiative (iREi) (2020) from Digital Line Graphs (DLGs). The DLGs were created by USGS from the 1:25,000-scale topographic maps (1996-1997).

Weather stations

This map shows the location of the active weather observation sites on the islands in Chuuk Lagoon. The data layer was created by Island Research & Education Initiative (iREi) (2020) using location information obtained from the National Weather Service office in Guam.