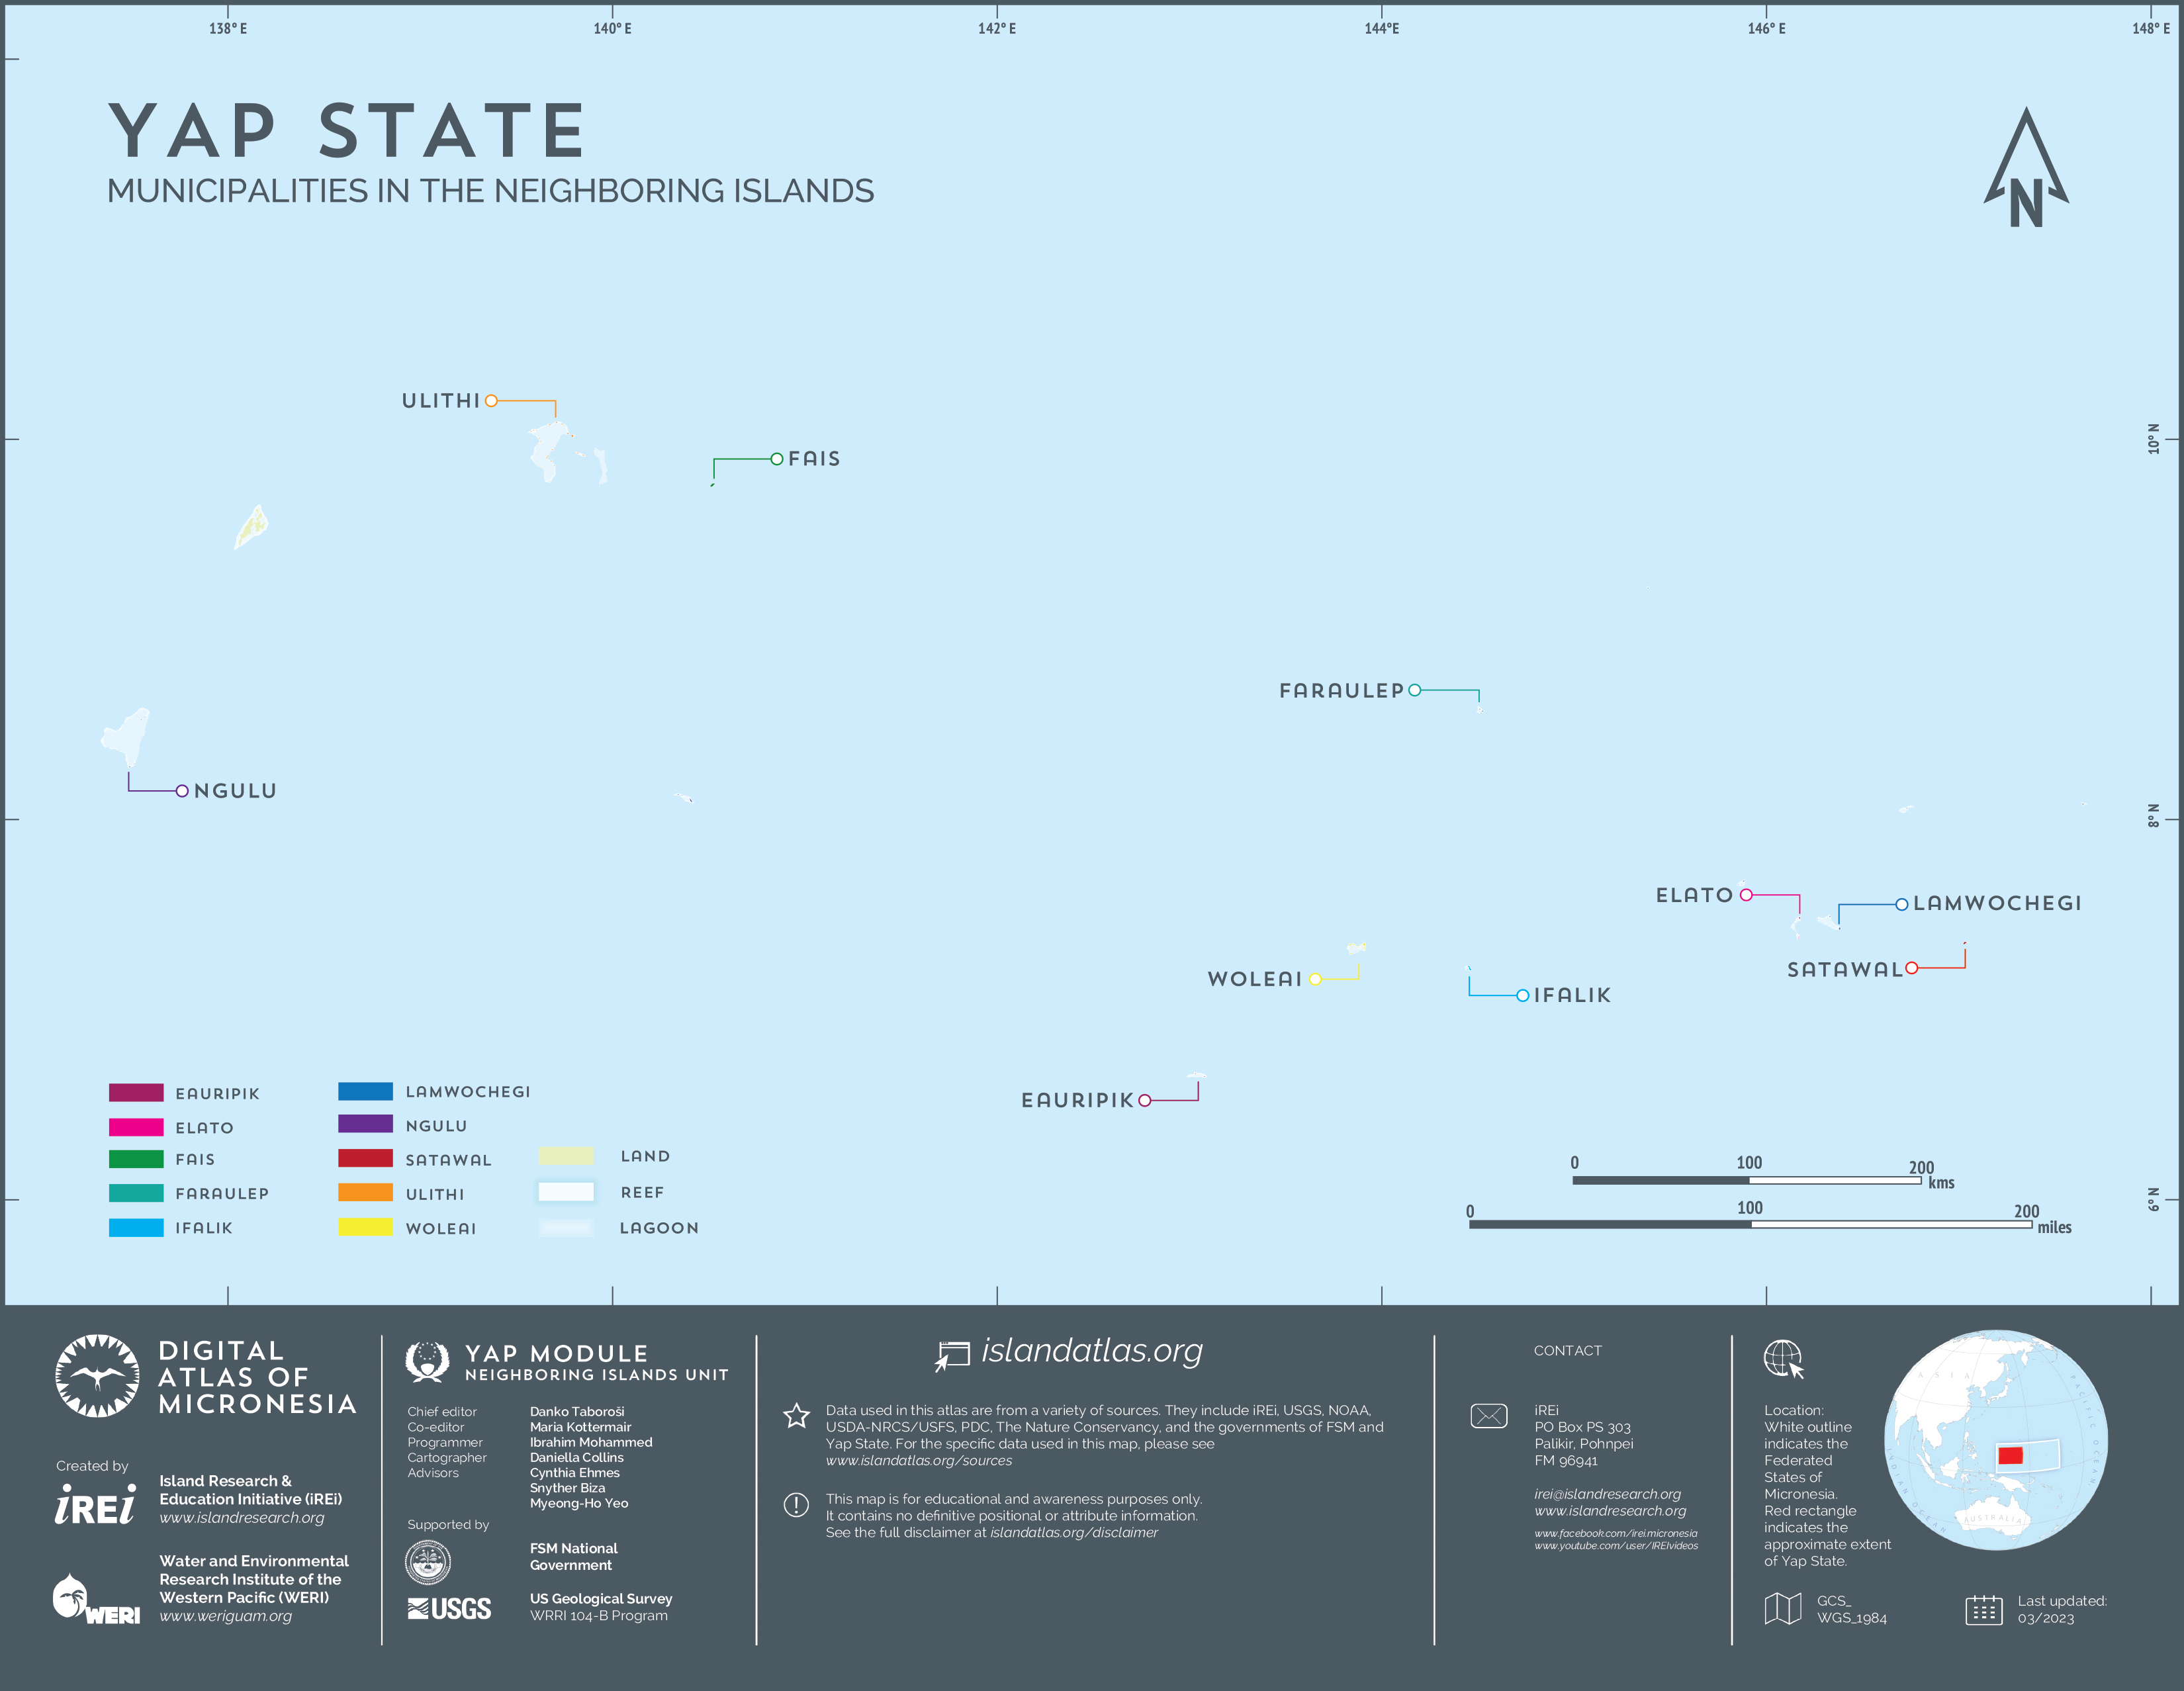
main logo

yap outer islands Maps: population

Administrative divisions

Municipalities

Municipalities

This map shows the administrative division of the Neighboring Islands of Yap into municipalities. The GIS file was created by Island Research & Education Initiative (iREi) (2023) based on the information from the individual State Constitutions and authoritative and the municipal affiliations of different areas are highly approximate and in no way definite. This map does not constitute any sort of recommendation, claim, or endorsement.

Toponymy

Place names [GNIS]

Place names

This map shows the locations of all named geographic features in the Neighboring Islands of Yap that are contained within the Geographic Names Information System (GNIS). The GNIS is the official database that contains all standard toponyms in the United States and its territories and associated states. It was developed by the U.S. Geological Survey (USGS) in cooperation with the U.S. Board on Geographic Names (BGN) in order to standardize place names. Island Research & Education Initiative (iREi) (2023) transferred this information to GIS format and shifted to match the most recent base layer; however, the shifted location could not always be verified leading to a low location accuracy in some cases. Note that the actual names contained in the dataset are copied exactly as they are in GNIS and are not necessarily correct or aligned with formal orthography of indigenous languages spoken in the Neighboring Islands of Yap.

Demographic and social indicators

Population, birthplace, and citizenship

Population by age and sex

This map shows the number of residents in the Neighboring Islands of Yap by municipality. It also provides information on sex and age distribution in the form of population pyramids for each municipality. The attribute tables in the actual dataset also contain details on median age and average annual population growth rate, as well as data from the ten municipalities on Yap Proper (not shown on the map). This geospatial dataset was created by Island Research & Education Initiative (iREi) (2023) using information from the FSM census of population and housing (2010).

Population density and growth

This map shows the population density in the Neighboring Islands of Yap by municipality. It also provides information on population growth from 1920 until 2010. This geospatial dataset was created by Island Research & Education Initiative (iREi) (2023) using information from the FSM census of population and housing (2010).

Ethnicity, marital status, and religion

Religion

This map shows the religious affiliation of residents of the Neighboring Islands of Yap who are aged 15 and above. The data are classified by municipality and also include more detailed information on specific churches involved (or absence of religious belief) and on marital status. This geospatial dataset was created by Island Research & Education Initiative (iREi) (2023) using information from the FSM census of population and housing (2010).

Literacy, language, and education

Literacy and language

This map shows the literacy rate of residents of the Neighboring Islands of Yap who are aged 5 and above. It also provides information on the first language spoken. The data are classified by municipality and also include more detailed information on literacy levels in specific languages spoken as the first or second language for persons aged 5, as well as the specific languages predominantly spoken in households for persons aged 3 and above. This geospatial dataset was created by Island Research & Education Initiative (iREi) (2023) using information from the FSM census of population and housing (2010).

School enrollment

This map shows the percentage of residents of the Neighboring Islands of Yap who are aged 3 and above and enrolled in schools. The data are classified by municipality and also include information on the number of students attending different types of schools. The attribute tables in the actual dataset contain additional details, including separate data for females and males. This geospatial dataset was created by Island Research & Education Initiative (iREi) (2023) using information from the FSM census of population and housing (2010).

Educational attainment

This map shows the percentage of residents of the Neighboring Islands of Yap who are aged 25 and above and graduated high school. The data are classified by municipality and also include information on the highest level of education attained by municipality. The attribute tables in the actual dataset also contain higher resolution data (breakdown by individual grade levels) and disaggregated data (separate for females and males). This geospatial dataset was created by Island Research & Education Initiative (iREi) (2023) using information from the FSM census of population and housing (2010).

Labor force, employment, and disabilities

Labor force

This map shows the percentage of residents of the Neighboring Islands of Yap who are aged 15 and above and in labor force. The data are classified by municipality and also include information on what portions of the labor force are formally employed, employed in home production, or unemployed. The attribute tables in the actual dataset contain additional details, including separate data for females and males. This geospatial dataset was created by Island Research & Education Initiative (iREi) (2023) using information from the FSM census of population and housing (2010).

Household type, tenure, and housing structure

Household type

This map shows the average number of persons per household in each municipality in the Neighboring Islands of Yap. The data also include information on the percentage of family members vs. non-family members within the households. The attribute tables in the actual dataset contain additional details on types of relationships between household members, number of persons living in group quarters (school dormitories, correctional facilities, etc.), and average number of persons per family. This geospatial dataset was created by Island Research & Education Initiative (iREi) (2023) using information from the FSM census of population and housing (2010).

Housing tenure

This map shows the ownership status of households (owned free and clear of loan vs. owned with loan or rented) and land (owned vs. leased) in each municipality in the Neighboring Islands of Yap. The attribute tables in the actual dataset contain additional details on specific ownership types involved. This geospatial dataset was created by Island Research & Education Initiative (iREi) (2023) using information from the FSM census of population and housing (2010).

Housing structure

This map shows the average number of rooms per household and the building materials used to make house roofs and walls in the Neighboring Islands of Yap. The data are classified by municipality. The attribute tables in the actual dataset contain additional details on specific building types, floor construction materials, age of buildings, and the number of persons per household and per room. This geospatial dataset was created by Island Research & Education Initiative (iREi) (2023) using information from the FSM census of population and housing (2010).

Sources of water and energy

Principal sources of water for drinking and washing

This map shows the percentage of households with access to piped water in the Neighboring Islands of Yap. The data are classified by municipality and also include information on specific sources used to obtain fresh water for drinking and washing. The attribute tables in the actual dataset contain additional details on toilet types and sewage disposal types in households. This geospatial dataset was created by Island Research & Education Initiative (iREi) (2023) using information from the FSM census of population and housing (2010).

Principal sources of energy for cooking and lighting

This map shows the percentage of households with complete kitchen facilities in the Neighboring Islands of Yap. The data are classified by municipality and also include information on energy sources for lighting and cooking. The attribute tables in the actual dataset contain additional details on specific types of energy sources. This geospatial dataset was created by Island Research & Education Initiative (iREi) (2023) using information from the FSM census of population and housing (2010).

Appliances, vehicles, and communications

Households with selected appliances

This map shows the percentage of households with complete kitchen facilities in the Neighboring Islands of Yap. The data are classified by municipality and also include information on energy sources for lighting and cooking. The attribute tables in the actual dataset contain additional details on specific types of energy sources. This geospatial dataset was created by Island Research & Education Initiative (iREi) (2023) using information from the FSM census of population and housing (2010).

Households with vehicles

This map shows the percentage of households that have at least one canoe, boat, or other type of vessel or vehicle in the Neighboring Islands of Yap. The data are classified by municipality and also include information on the total number of households with cars, boats with engine, and canoes and boats without engine. The attribute tables in the actual dataset contain additional details about other vehicles (trucks, buses, motorbikes) and detailed information on specific numbers of each vehicle type per household. This geospatial dataset was created by Island Research & Education Initiative (iREi) (2023) using information from the FSM census of population and housing (2010).

Households with telephones

This map shows the percentage of households that have at least one telephone land line in the Neighboring Islands of Yap. The data are classified by municipality and also include information on the relative availability of cell phones. The attribute tables in the actual dataset contain additional details on the number of fixed and cellular phones, as well as radios and computers per household. This geospatial dataset was created by Island Research & Education Initiative (iREi) (2023) using information from the FSM census of population and housing (2010).

Internet usage

This map shows the percentage of households that have a functioning Internet connection in the Neighboring Islands of Yap. The data are classified by municipality and also include information on the relative number of people who access the Internet. The attribute tables in the actual dataset contain additional details on the frequency of Internet use. This geospatial dataset was created by Island Research & Education Initiative (iREi) (2023) using information from the FSM census of population and housing (2010).