main logo

kosrae Maps: population

Administrative divisions

Municipalities

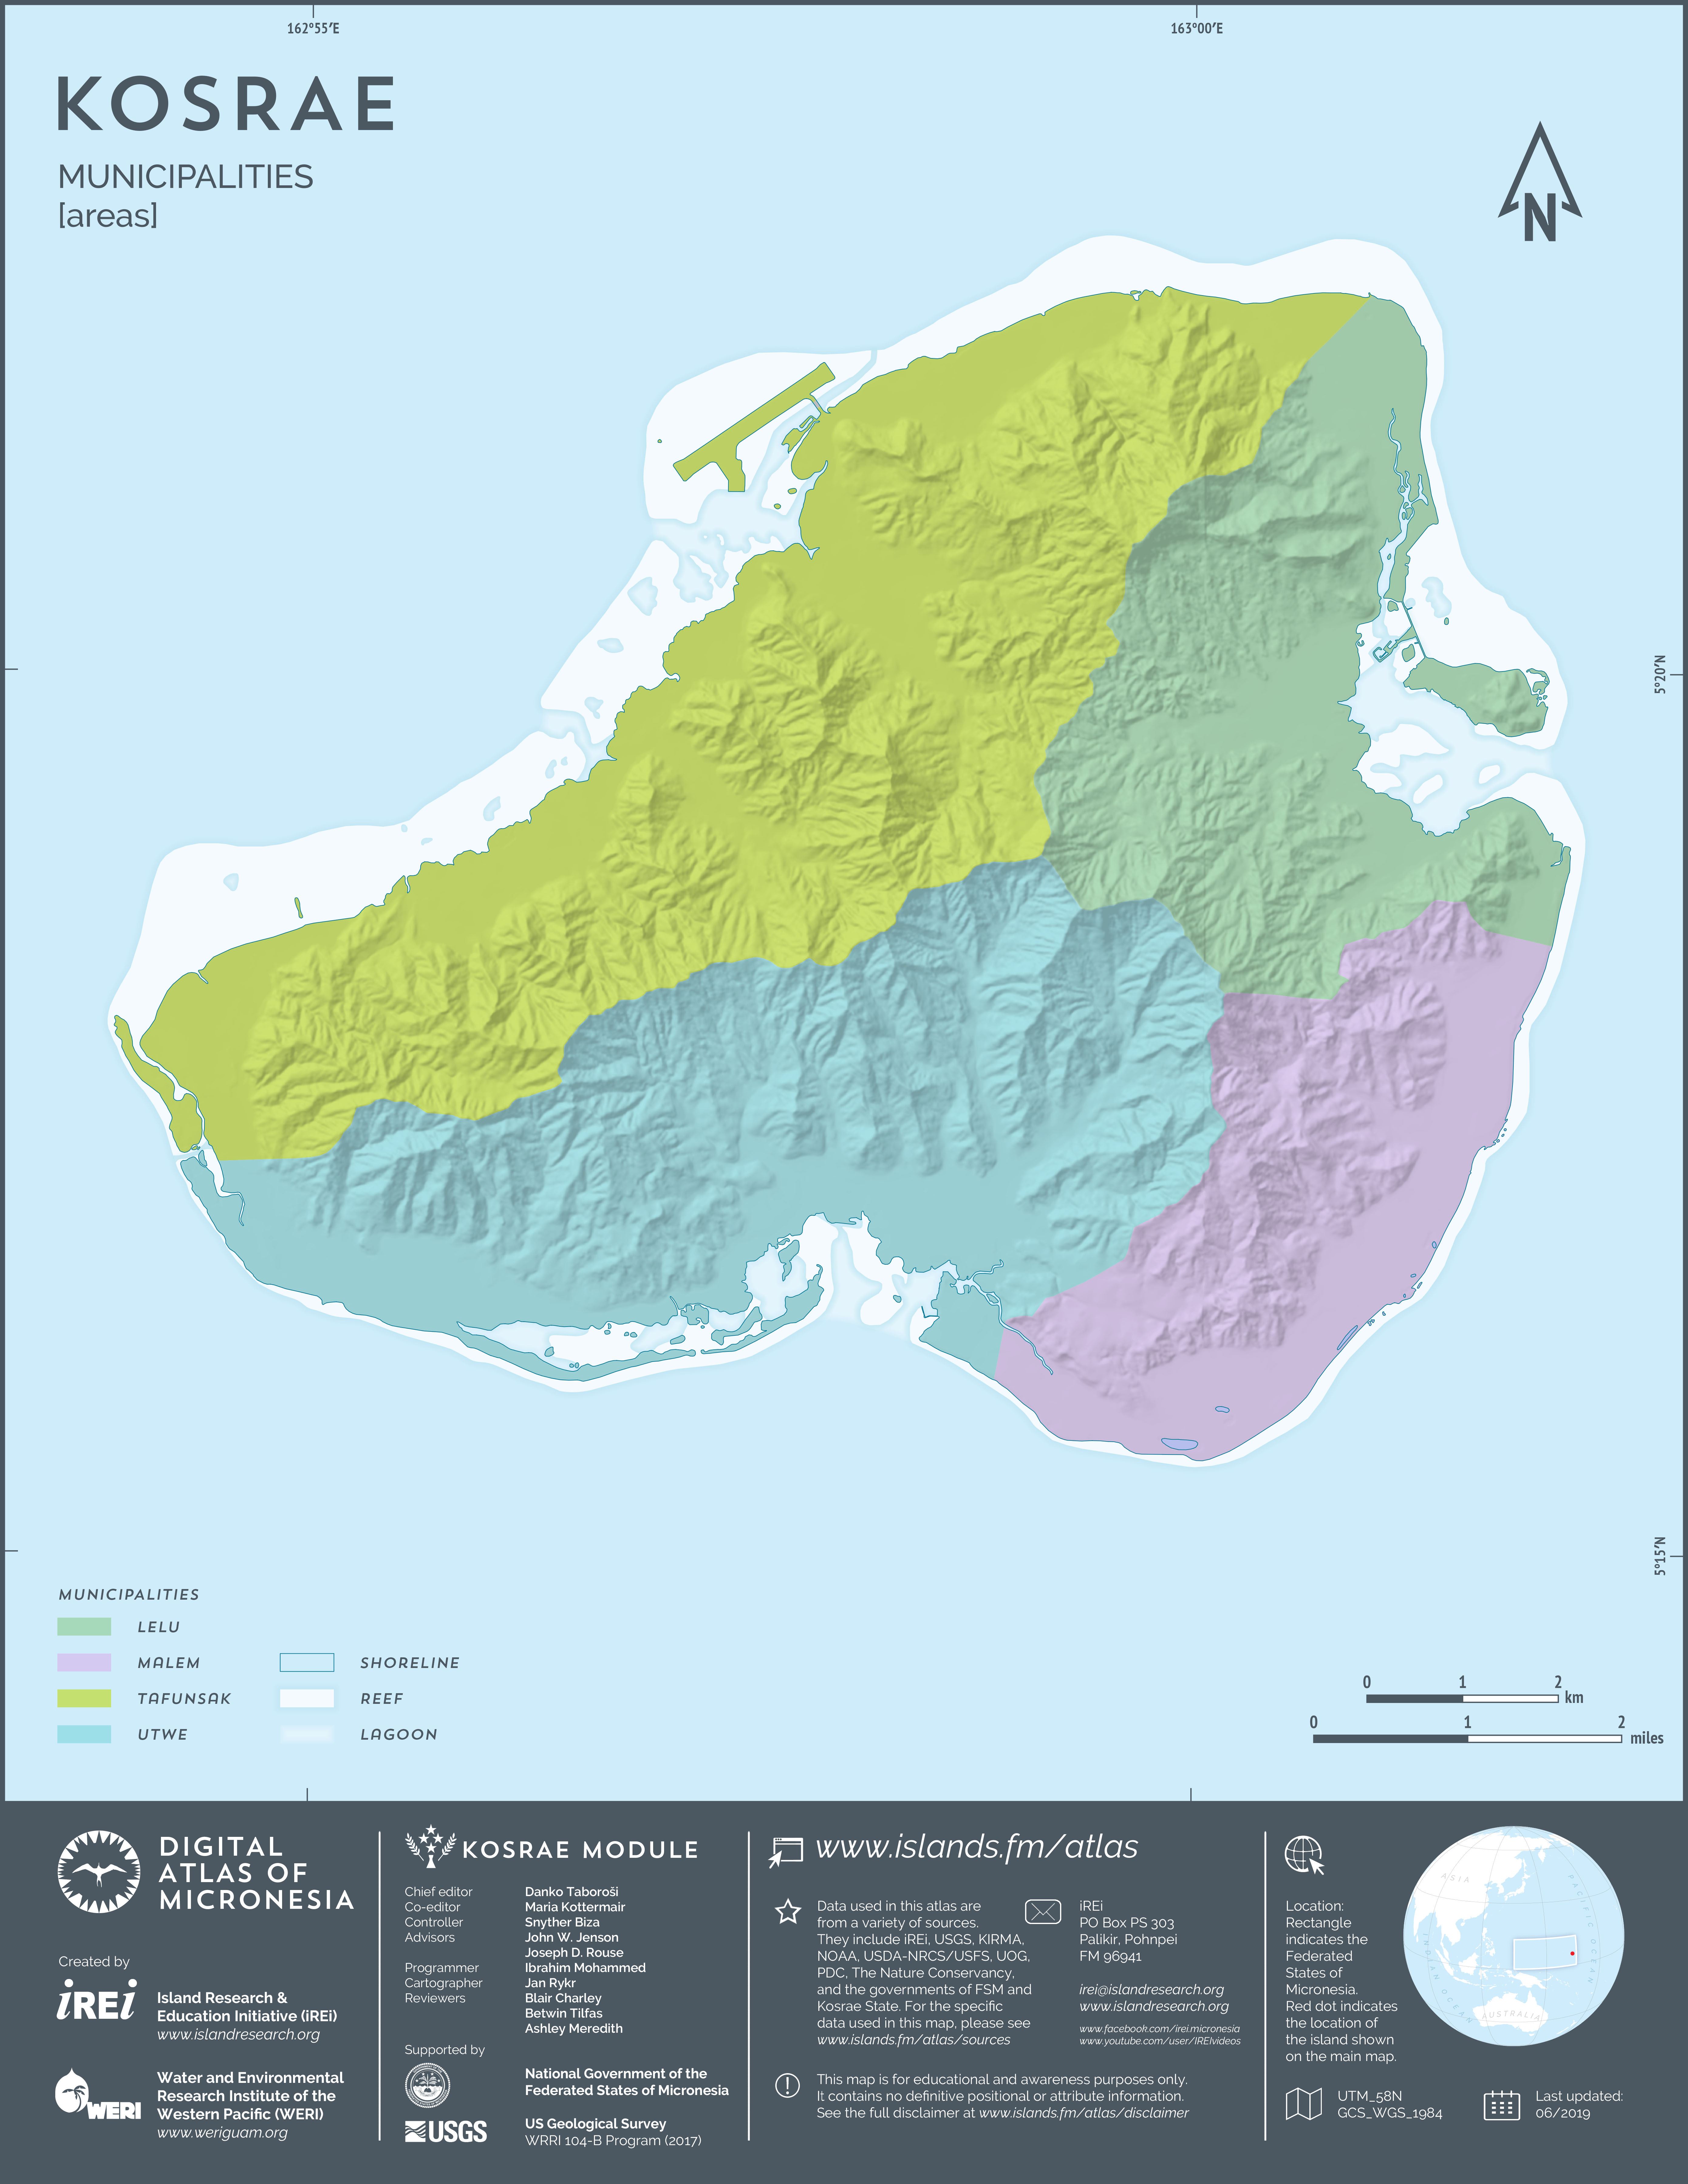
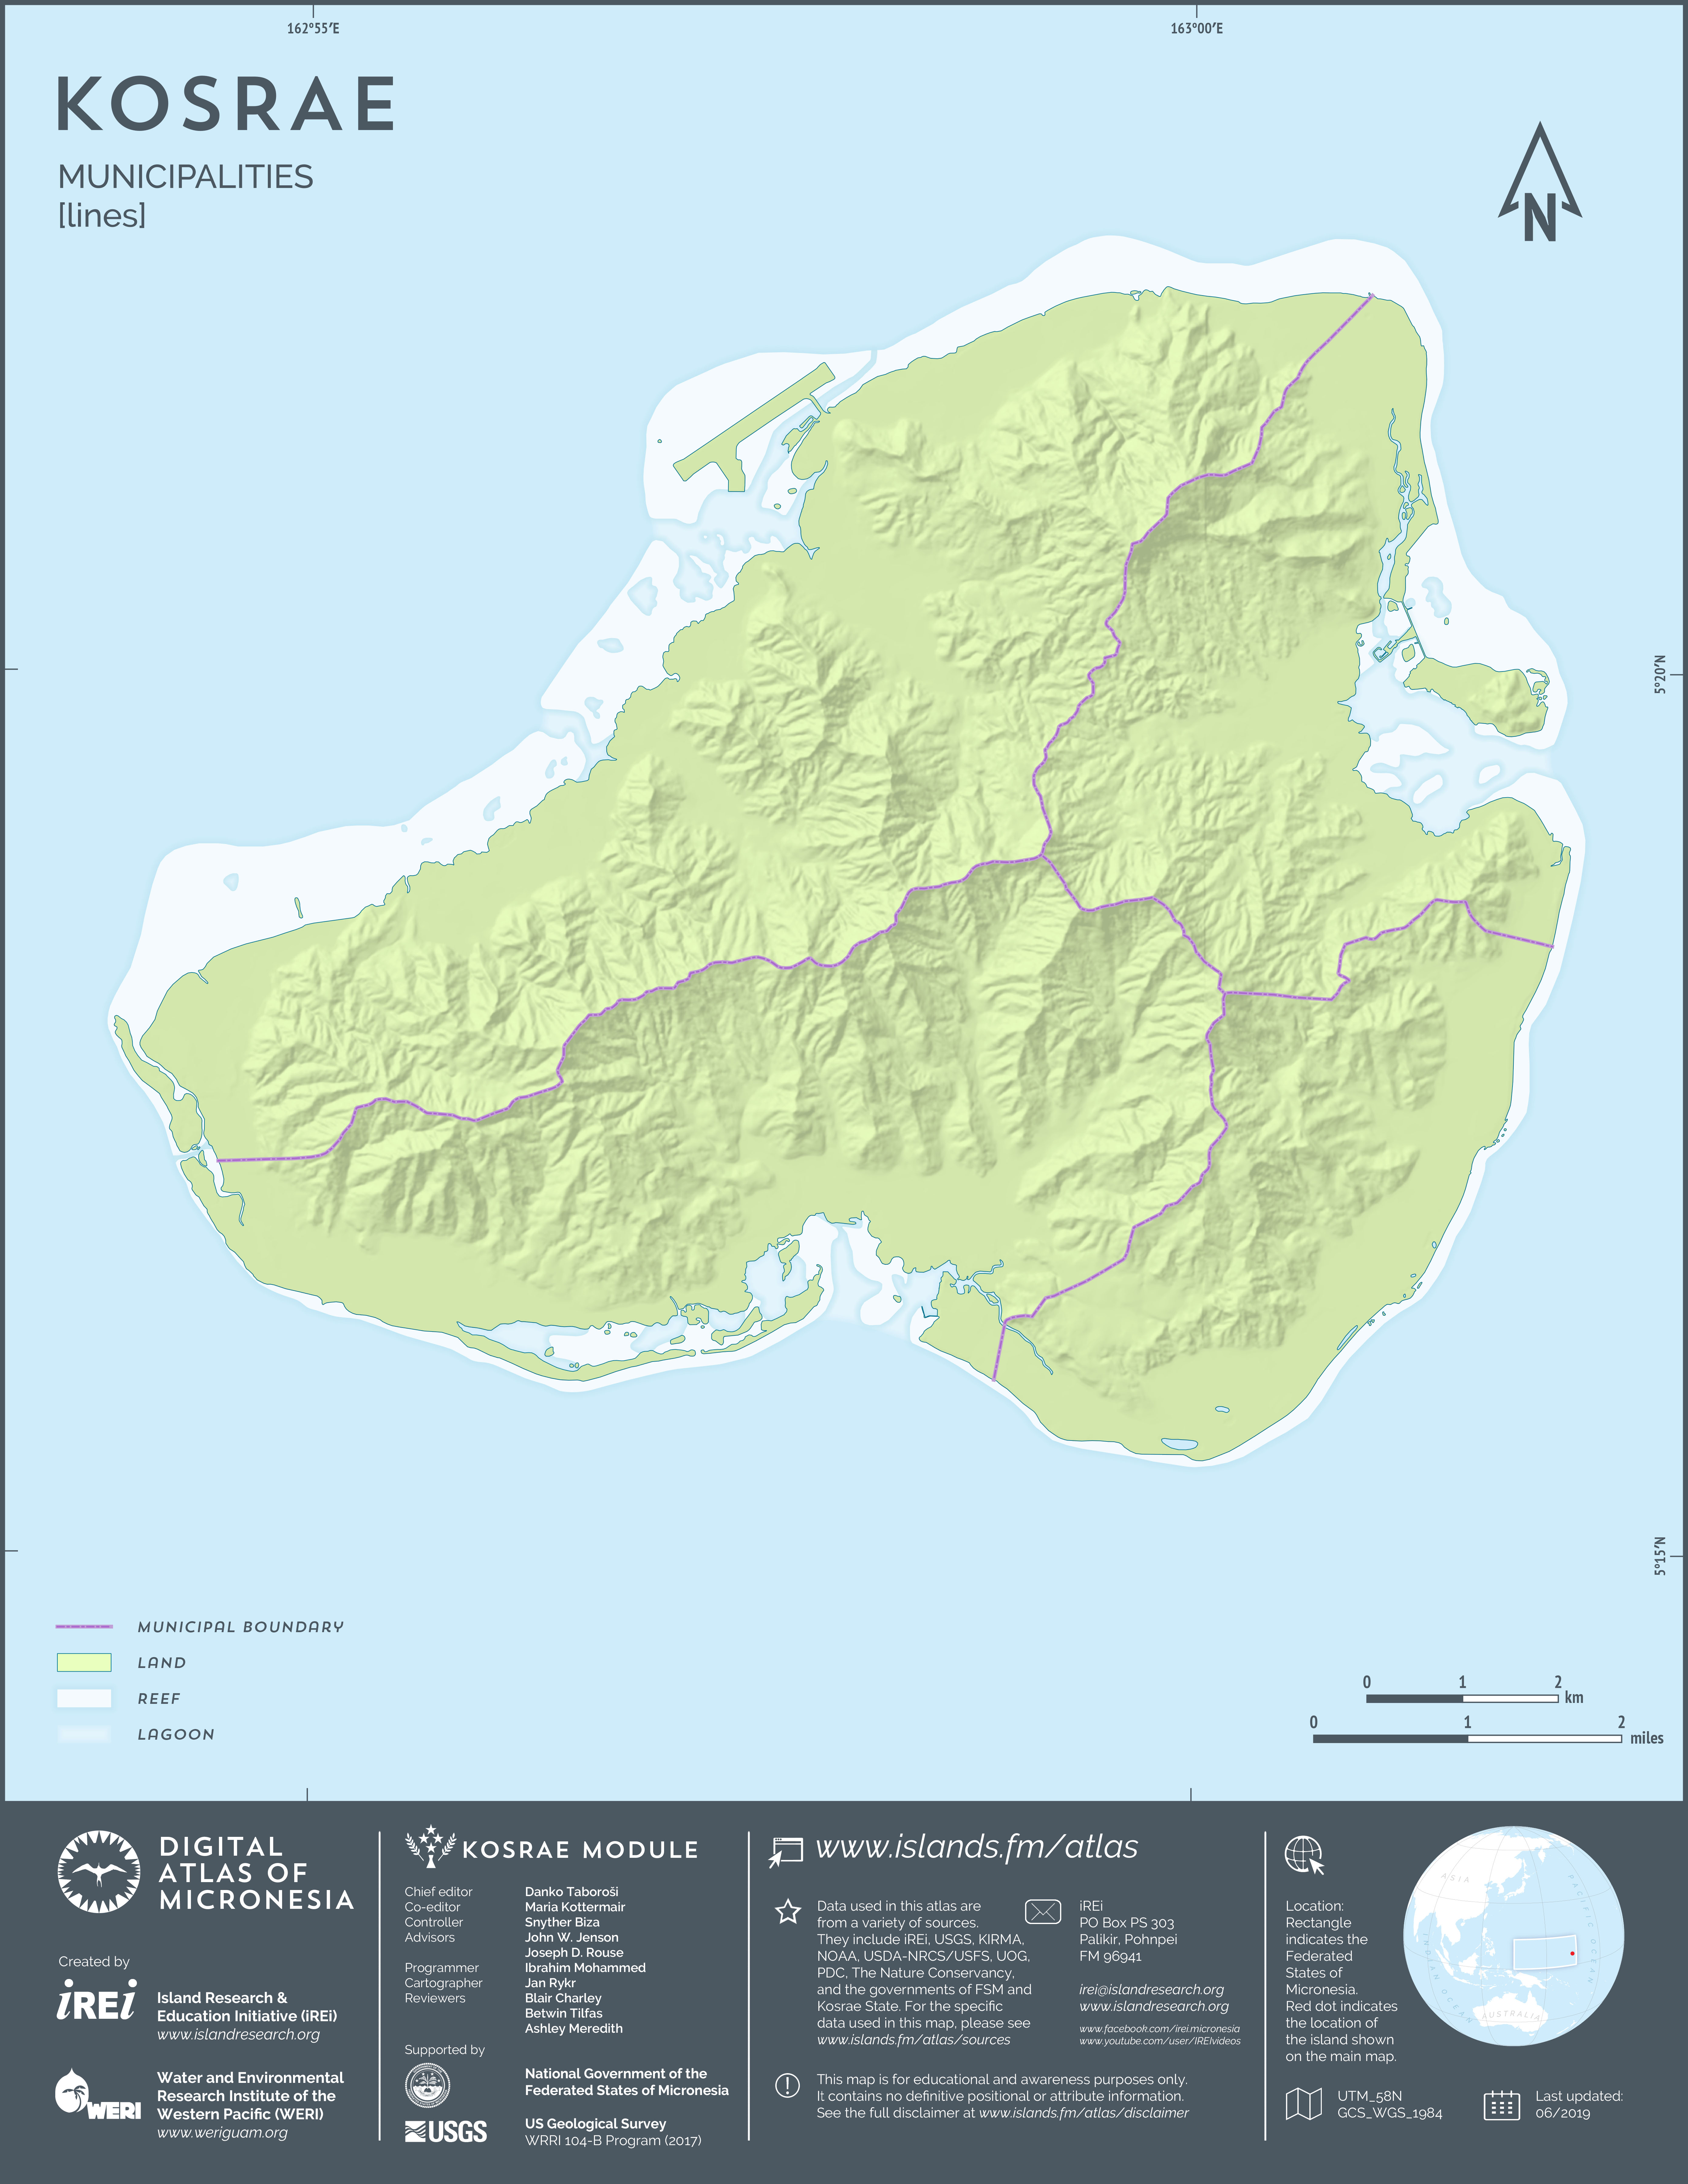
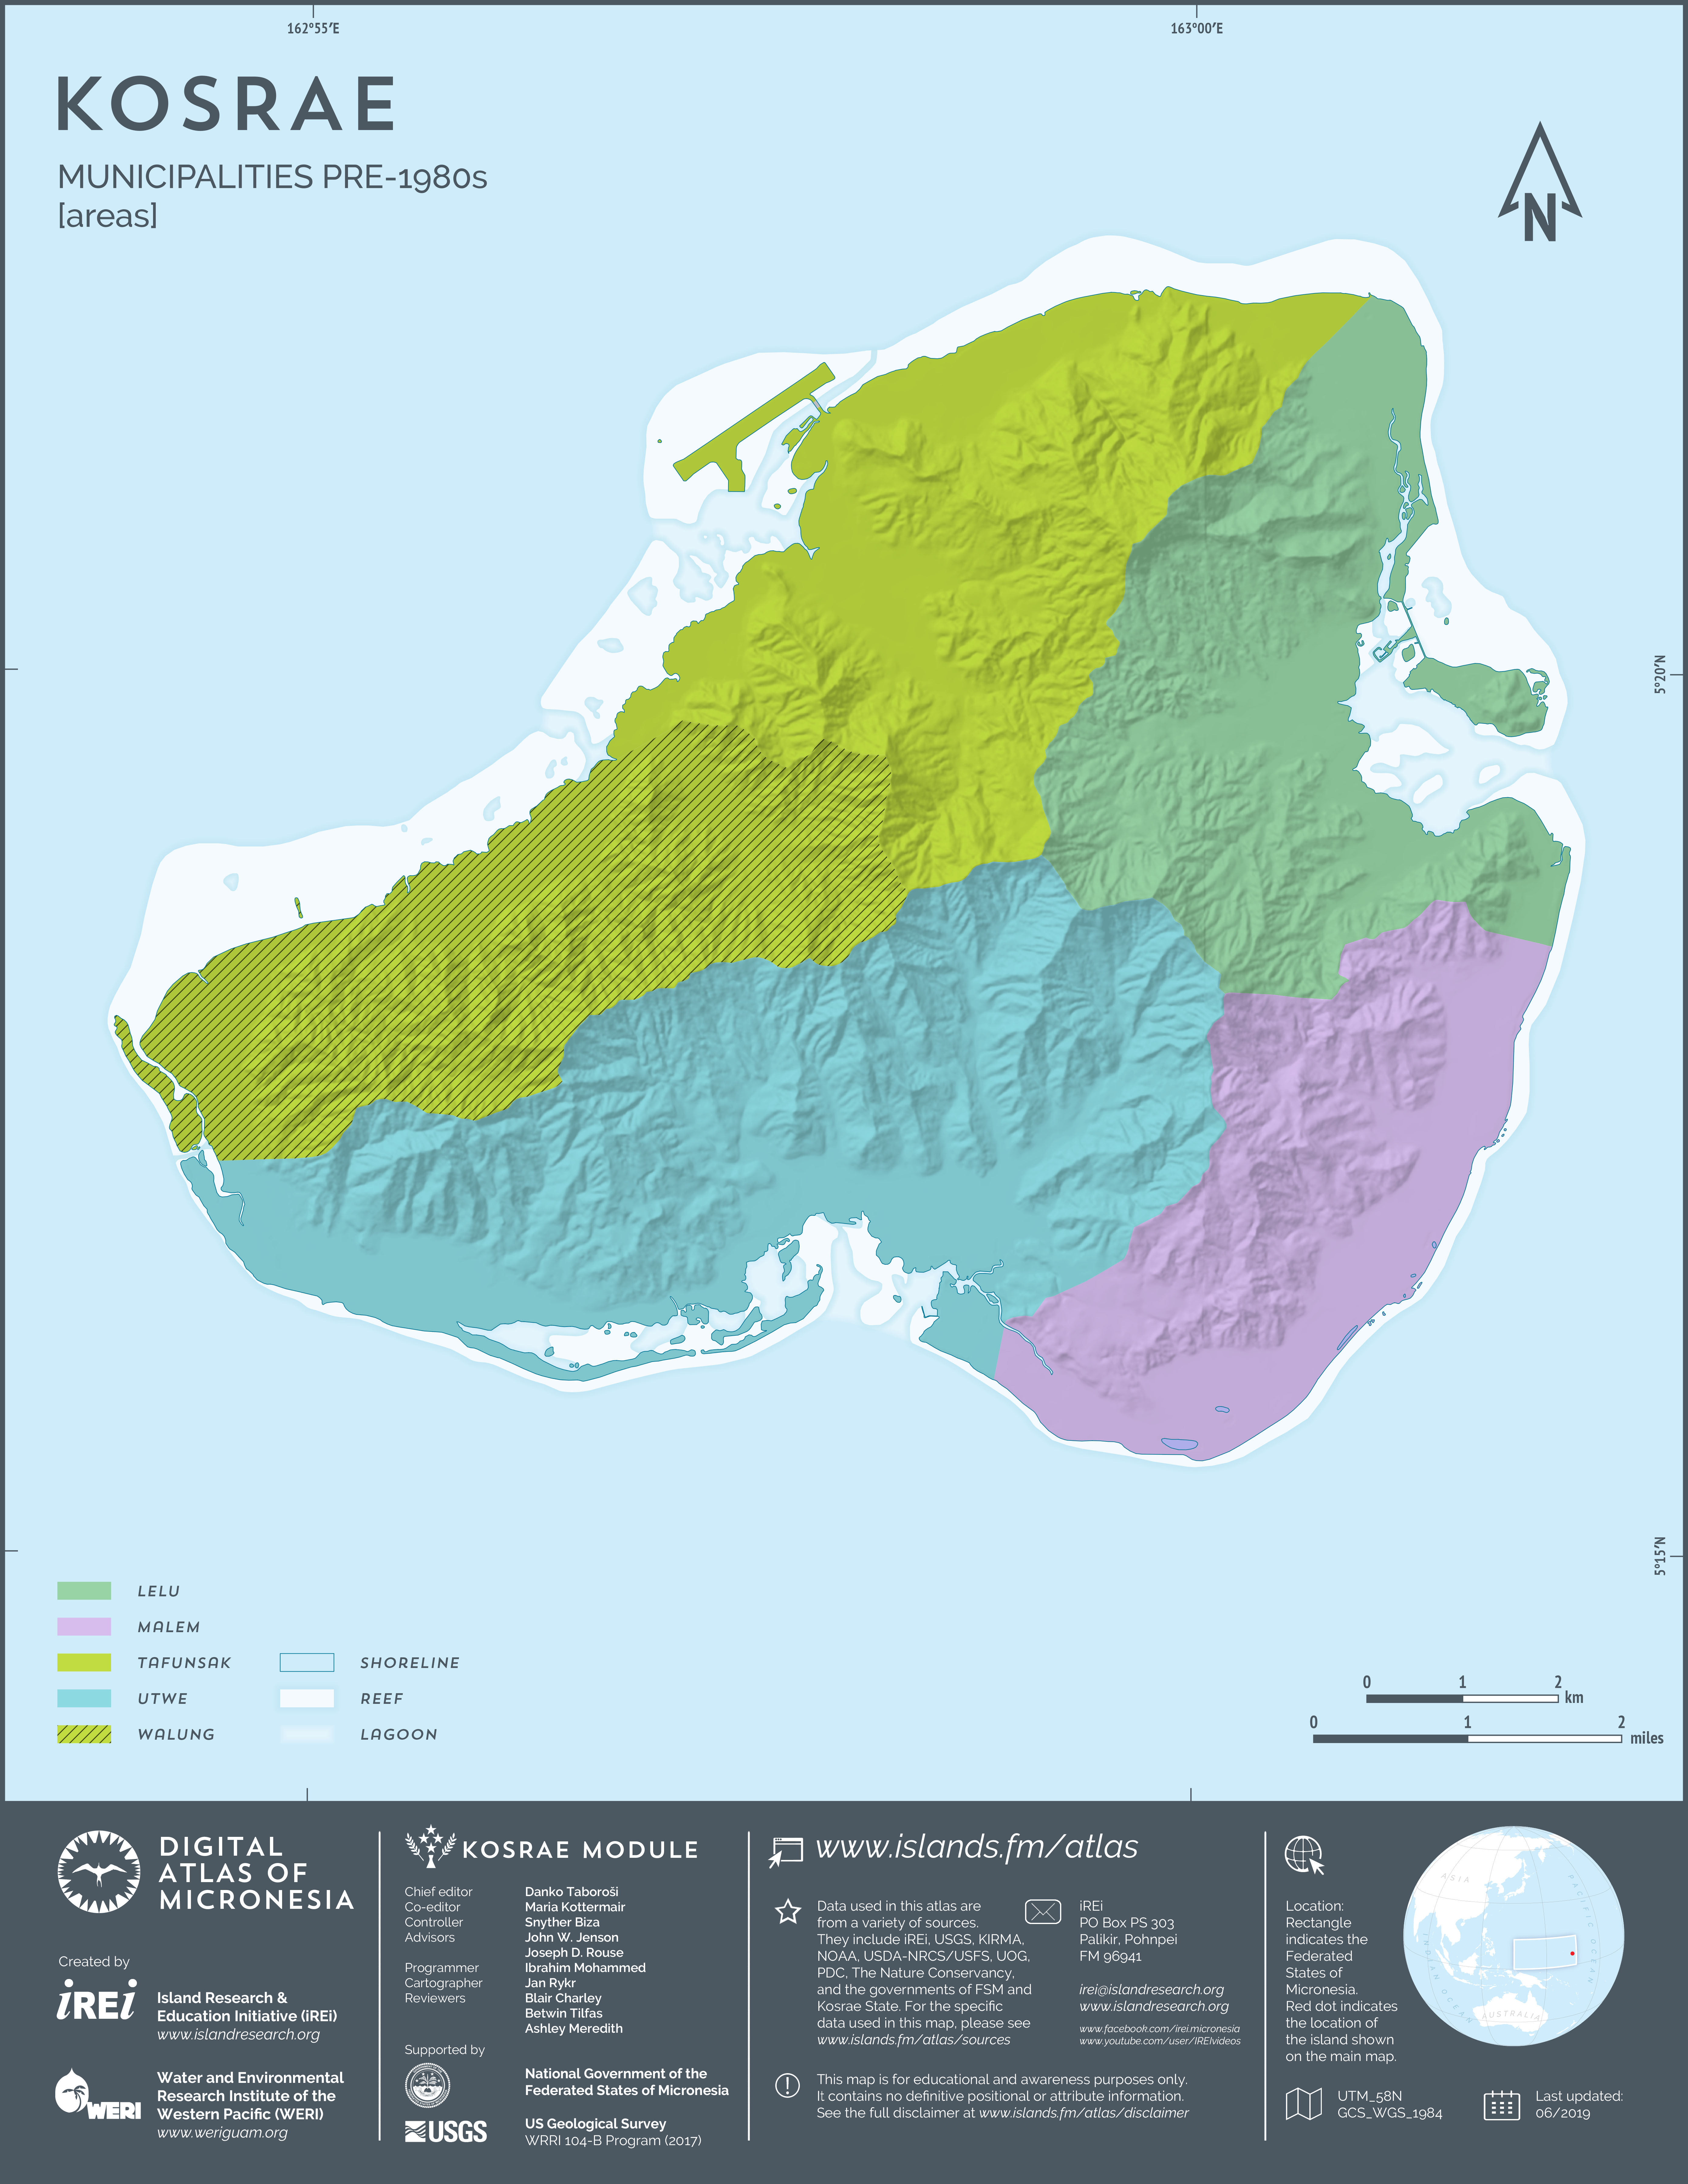
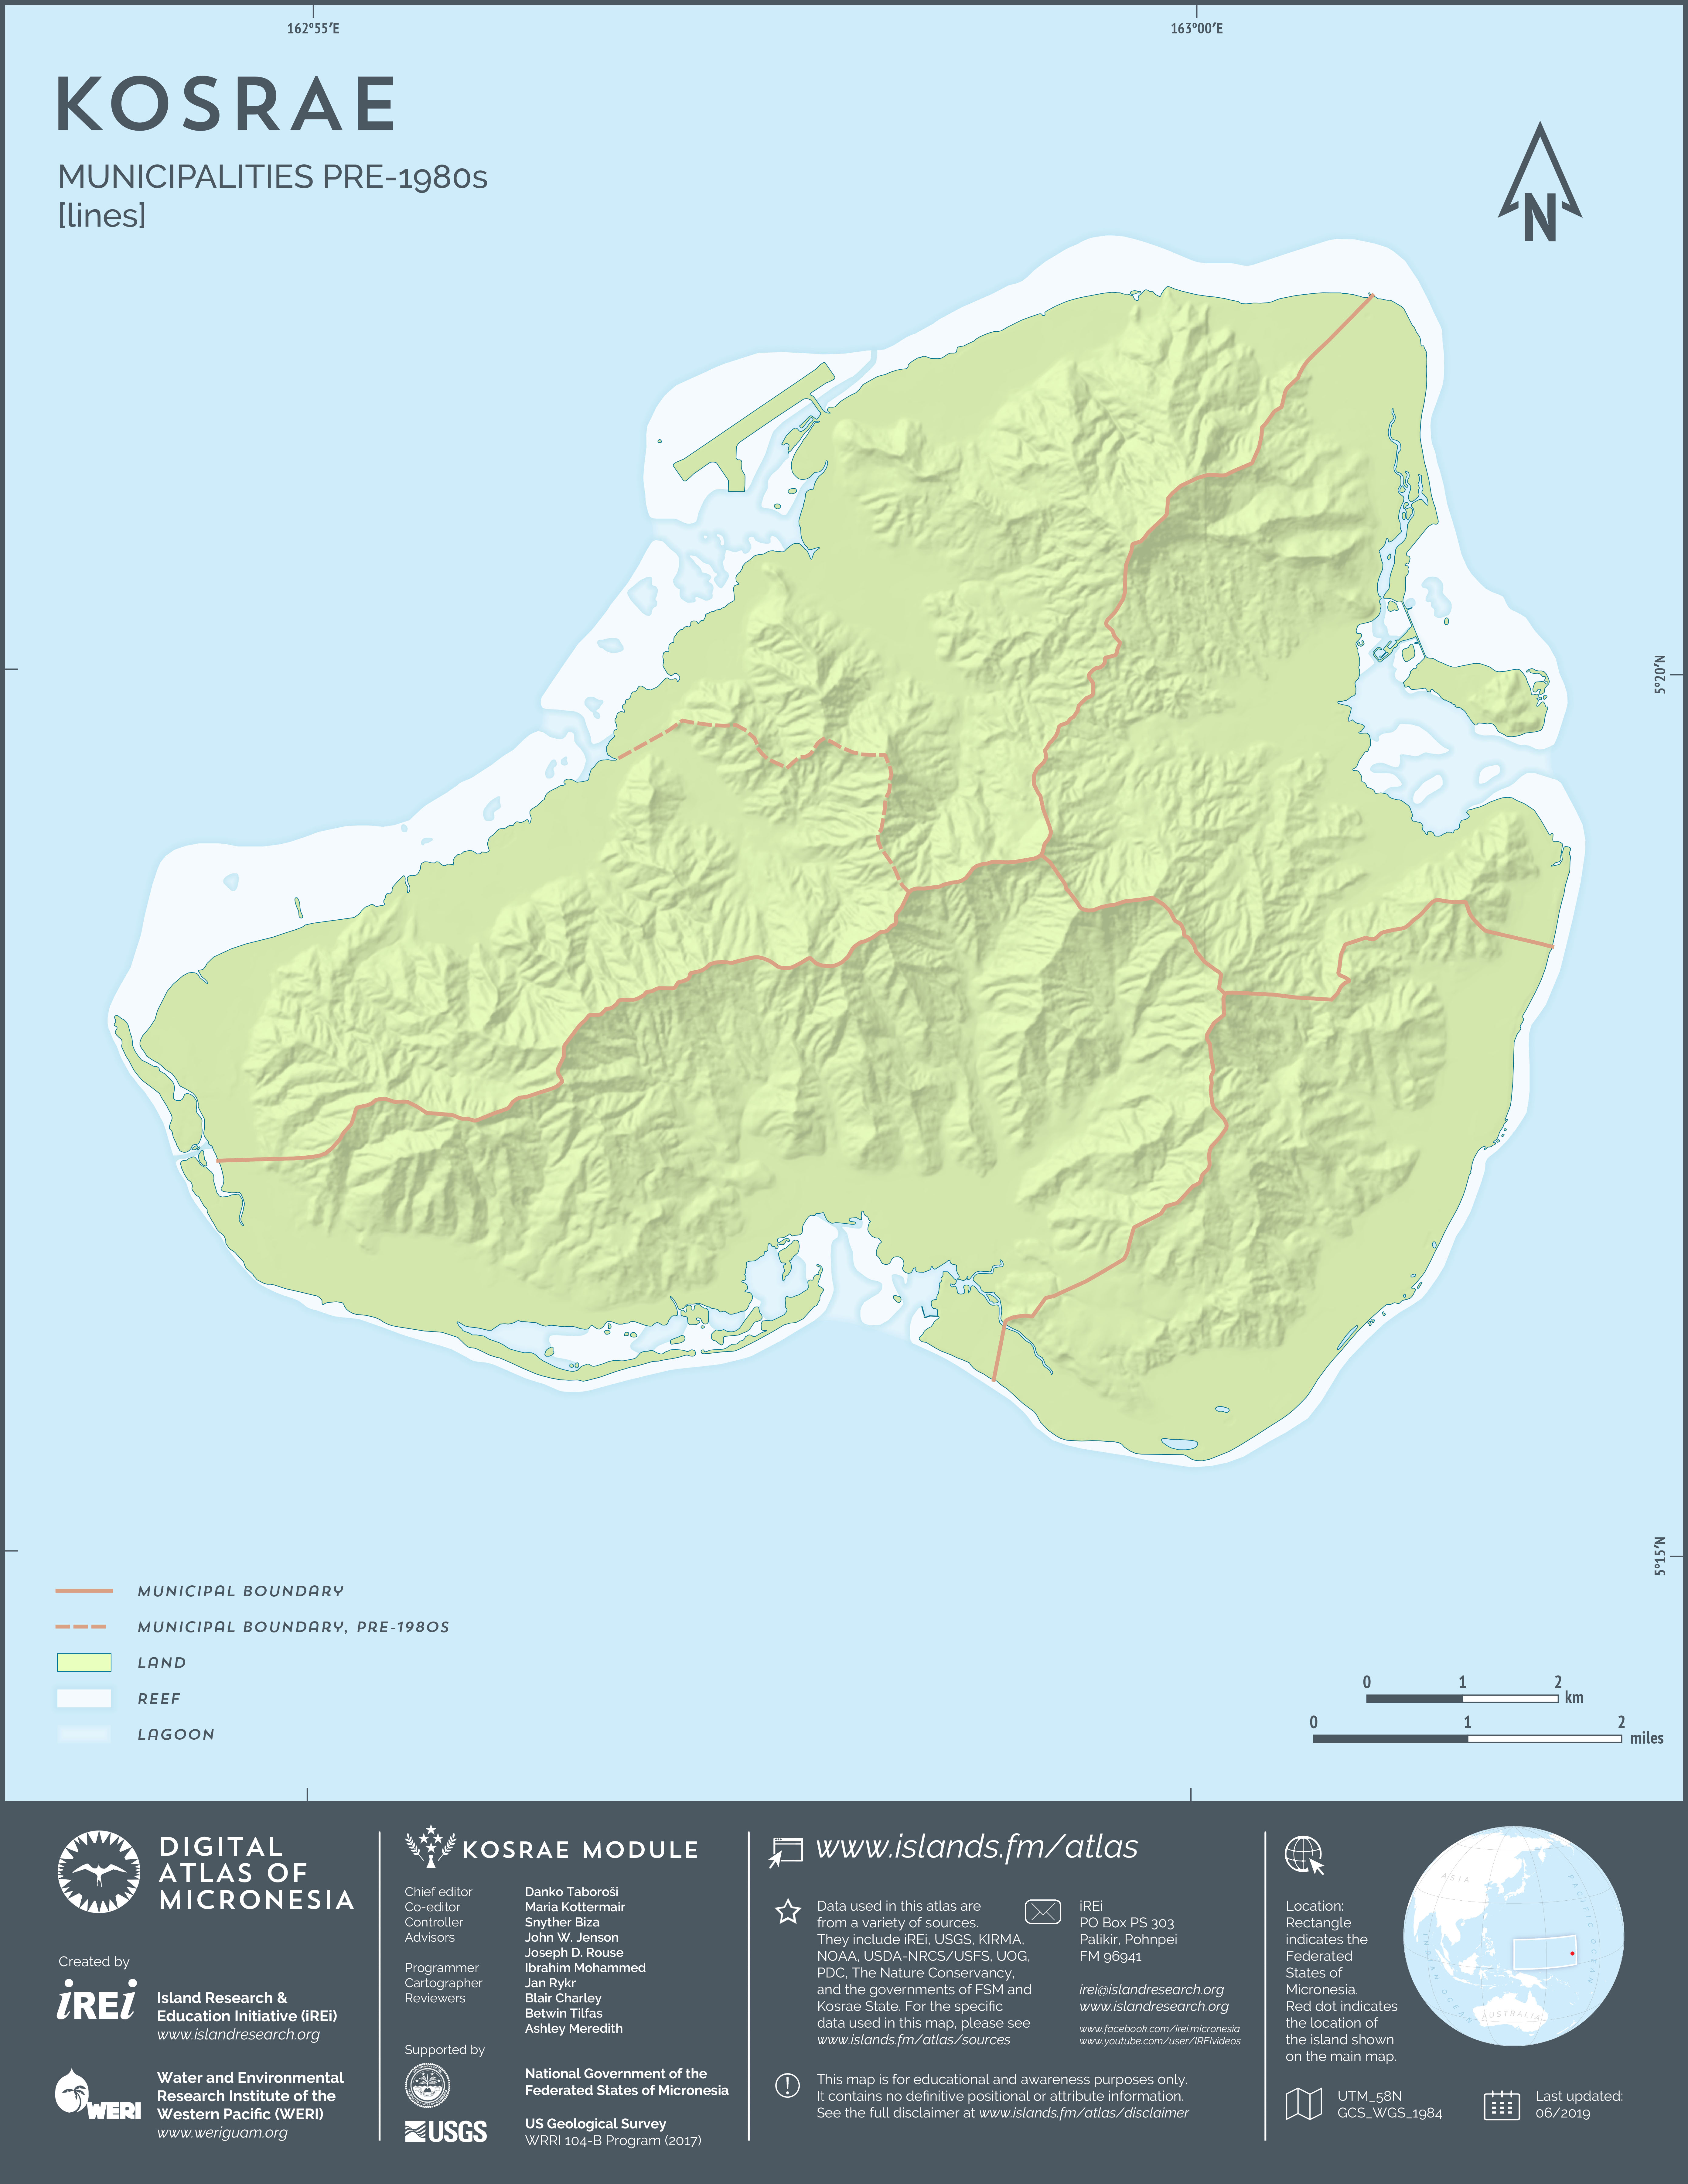
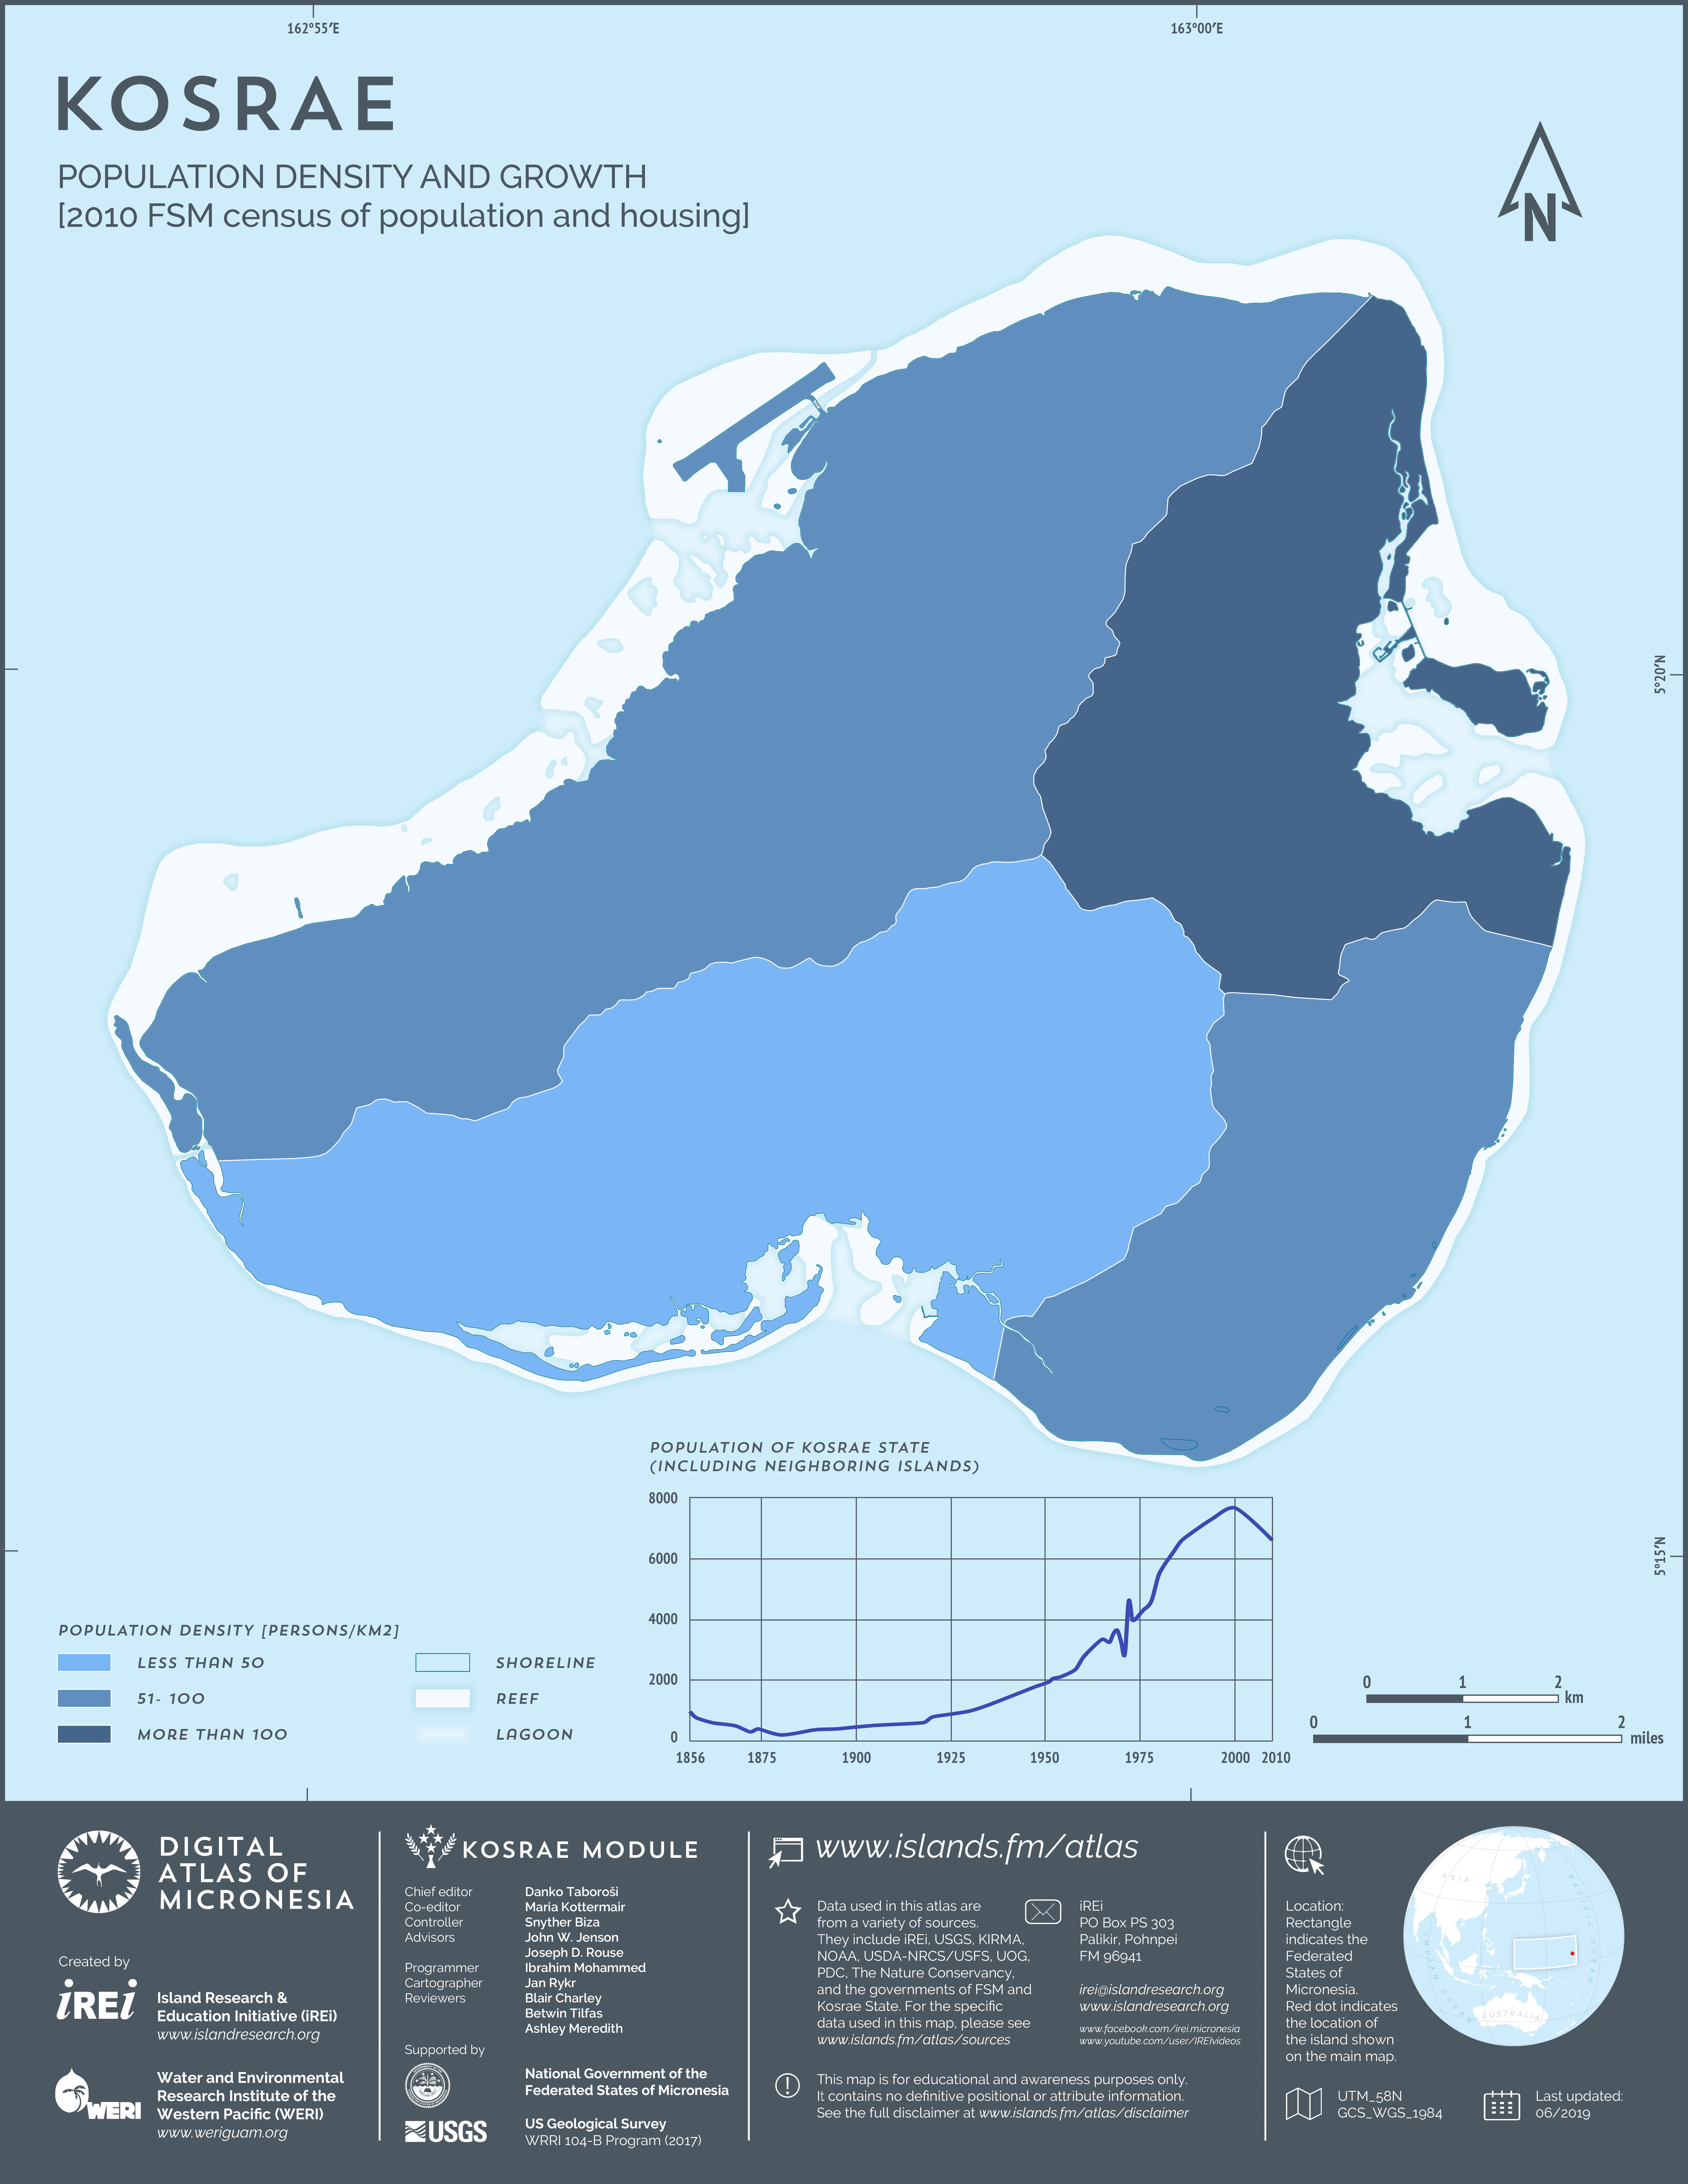
Municipalities [areas]

This map shows the four municipalities of Kosrae. The original data, so-called Digital Line Graphs (DLSs), were created by U.S. Geological Survey (USGS) for the 1:25,000-scale topographic maps (2001). The data were modified by Island Research & Education Initiative (iREi) (2019) to fit the most recent base layer. Note that boundaries shown in this map are not definite. This map does not constitute any sort of recommendation, claim, or endorsement.

Municipalities [lines]

This map shows the four municipalities of Kosrae. The original data, so-called Digital Line Graphs (DLSs), were created by U.S. Geological Survey (USGS) for the 1:25,000-scale topographic maps (2001). The data were modified by Island Research & Education Initiative (iREi) (2019) to fit the most recent base layer. Note that boundaries shown in this map are not definite. This map does not constitute any sort of recommendation, claim, or endorsement.

Traditional divisions

Municipalities pre-1980s [areas]

This map shows the four municipalities of Kosrae plus the fifth municipality, Walung, before it was merged with Tafunsak in the 1980s. The original data, so-called Digital Line Graphs (DLSs), were created by U.S. Geological Survey (USGS) for the 1:25,000-scale topographic maps (2001). The data were modified by Island Research & Education Initiative (iREi) (2019) to fit the most recent base layer. Note that boundaries shown in this map are not definite. This map does not constitute any sort of recommendation, claim, or endorsement.

Municipalities pre-1980s [lines]

This map shows the lines separating the four municipalities of Kosrae plus the fifth municipality, Walung, before it was merged with Tafunsak in the 1980s. The original data, so-called Digital Line Graphs (DLSs), were created by U.S. Geological Survey (USGS) for the 1:25,000-scale topographic maps (2001). The data were modified by Island Research & Education Initiative (iREi) (2019) to fit the most recent base layer. Note that boundaries shown in this map are not definite. This map does not constitute any sort of recommendation, claim, or endorsement.

Capitals

National and state capitals

Capitals

This map shows the locations of Tofol, the state capital of the Kosrae State, and Lelu, the island's main traditional center and historic capital. The data layer was created by Island Research & Education Initiative (iREi) (2019).

Toponymy

Place names [GNIS]

Place names

This map shows the locations of all named geographic features on Kosrae that are contained within the Geographic Names Information System (GNIS). The GNIS is the official database that contains all standard toponyms in the U.S. and its territories and associated states. It was developed by the U.S. Geological Survey (USGS) in cooperation with the U.S. Board on Geographic Names (BGN) in order to standardize place names. Island Research & Education Initiative (iREi) (2019) transferred this information to GIS format and shifted to match the most recent base layer and 2015-2018 WorldView-2 satellite imagery. Note that the actual names contained in the dataset are copied exactly as they are in GNIS and are not necessarily correct or aligned with Kosraean orthography.

Demographic and social indicators

Population, birthplace, and citizenship

Population by age and sex

This map shows the number of residents of Kosrae by municipality, and also provides information on sex and age distribution in the form of population pyramids for each municipality. The attribute tables in the actual dataset also contain information on median age and average annual population growth rate. This geospatial dataset was created by Island Research & Education Initiative (iREi) (2019) using information from the FSM census of population and housing (2010).

Population density and growth

This map shows the population density of Kosrae by municipality, and also provides information on population growth in Kosrae from 1920 until 2010. The map was created using the same data layer as the map that shows population by age and sex. This geospatial dataset was created by Island Research & Education Initiative (iREi) (2019) using information from the FSM census of population and housing (2010).

Birthplace

This map shows the percentage of residents born outside of Kosrae by municipality. The attribute tables in the actual dataset contain very detailed information on specific places of birth and citizenship status. This dataset was created by Island Research & Education Initiative (iREi) (2019) using information from the FSM census of population and housing (2010).

Ethnicity, marital status, and religion

Ethnicity

This map shows the percentage of ethnically Kosraean residents by municipality, and also provides information on the relative proportion of people identifying with one vs. more than one ethnicity. The attribute tables in the actual dataset contain more detailed information on the full range of specific ethnic identities involved. This dataset was created by Island Research & Education Initiative (iREi) (2019) using information from the FSM census of population and housing (2000) and the FSM census of population and housing (2010).

Religion

This map shows the religious affiliation of Kosraean residents aged 15 and above by municipality. The attribute tables in the actual dataset contain more detailed information on specific churches involved (or absence of religious belief) and on marital status. This dataset was created by Island Research & Education Initiative (iREi) (2019) using information from the FSM census of population and housing (2010).

Literacy, language, and education

Literacy and language

This map shows the literacy rate of Kosraean residents aged 5 and above by municipality, and also provides information on the first language spoken. The attribute tables in the actual dataset contain more detailed information on literacy levels in specific languages spoken as the first or second language for persons aged 5, as well as the specific languages predominantly spoken in households for persons aged 3 and above. This dataset was created by Island Research & Education Initiative (iREi) (2019) using information from the FSM census of population and housing (2010).

School enrollment

This map shows the percentage of Kosraean residents aged 3 and above enrolled in schools by municipality, and also provides information on the number of students attending different types of schools. The attribute tables in the actual dataset contain more detailed information, including separate data for females and males. This dataset was created by Island Research & Education Initiative (iREi) (2019) using information from the FSM census of population and housing (2010).

Educational attainment

This map shows the percentage of Kosraean residents aged 25 and above who graduated high school and also provides information on the highest level of education attained by municipality. The attribute tables in the actual dataset contain information at a higher resolution (breakdown by individual grade levels) and separate data for females and males. This dataset was created by Island Research & Education Initiative (iREi) (2019) using information from the FSM census of population and housing (2010).

Labor force, employment, and disabilities

Labor force

This map shows the percentage of Kosraean residents aged 15 and above who are in labor force per municipality, and also provides information on what portions of the labor force are formally employed, employed in home production, or unemployed. The attribute tables in the actual dataset contain more detailed information, including separate data for females and males. This dataset was created by Island Research & Education Initiative (iREi) (2019) using information from the FSM census of population and housing (2010).

Home production

This map shows the percentage of Kosraean residents aged 15 and above who are engaged in home production per municipality, and also provides information on what portions of home production are intended for own consumption, sale, or both. The attribute tables in the actual dataset also contain information on formal employment, including types of jobs, general areas of employment, and the type of employer. This dataset was created by Island Research & Education Initiative (iREi) (2019) using information from the FSM census of population and housing (2010).

Household type, tenure, and housing structure

Household type

This map shows the average number of persons per household in each municipality on Kosrae, and also provides information on the percentage of family members vs. non-family members within the households. The attribute tables in the actual dataset contain more detailed information on types of relationships between household members, number of persons living in group quarters (school dormitories, correctional facilities, etc.), and average number of persons per family. This dataset was created by Island Research & Education Initiative (iREi) (2019) using information from the FSM census of population and housing (2010).

Housing tenure

This map shows the ownership status of households (owned free and clear of loan vs. owned with loan or rented) and land (owned vs. leased) in each municipality on Kosrae. The attribute tables in the actual dataset contain more detailed information on specific ownership types involved. This dataset was created by Island Research & Education Initiative (iREi) (2019) using information from the FSM census of population and housing (2010).

Housing structure

This map shows the average number of rooms per household and the building materials used to make house roofs and walls in each municipality on Kosrae. The attribute tables in the actual dataset also contain information on specific building types, floor construction materials, age of buildings, and the number of persons per household and per room. This dataset was created by Island Research & Education Initiative (iREi) (2019) using information from the FSM census of population and housing (2010).

Sources of water and energy

Principal sources of water for drinking and washing

This map shows the percentage of households in each municipality on Kosrae that have access to piped water, and also provides information on specific sources used to obtain fresh water for drinking and washing. The attribute tables in the actual dataset also contain information on toilet types and sewage disposal types in households. This dataset was created by Island Research & Education Initiative (iREi) (2019) using information from the FSM census of population and housing (2010).

Principal sources of energy for cooking and lighting

This map shows the percentage of households in each municipality on Kosrae that have complete kitchen facilities, and also provides information on energy sources for lighting and cooking. The attribute tables in the actual dataset contain more detailed information on specific types of energy sources. This dataset was created by Island Research & Education Initiative (iREi) (2019) using information from the FSM census of population and housing (2010).

Appliances, vehicles, and communications

Households with selected appliances

This map shows the percentage of households in each municipality on Kosrae that possess a sink and/or a refrigerator. The attribute tables in the actual dataset contain more detailed information on specific numbers of sinks and refrigerators, as well as other amenities including air conditioning units, generators, DVD/VCR players, and television sets with and without cable TV connection. The dataset was created by Island Research & Education Initiative (iREi) (2019) using information from the FSM census of population and housing (2010).

Households with vehicles

This map shows the percentage of households in each municipality on Kosrae that have at least one car, and also provides information on the total number of households with cars, boats with engine, and canoes and boats without engine. The attribute tables in the actual dataset also contain information about other vehicles (trucks, buses, motorbikes) and detailed information on specific numbers of each vehicle type per household. The dataset was created by Island Research & Education Initiative (iREi) (2019) using information from the FSM census of population and housing (2010).

Households with telephones

This map shows the percentage of households in each municipality on Kosrae that have at least one telephone land line, and also provides information on the relative availability of cell phones. The attribute tables in the actual dataset also contain detailed information on the number of fixed and cellular phones, as well as radios and computers per household. The dataset was created by Island Research & Education Initiative (iREi) (2019) using information from the FSM census of population and housing (2010).

Internet usage

This map shows the percentage of households in each municipality on Kosrae that have a functioning Internet connection, and also provides information on the relative number of people who access the Internet. The attribute tables in the actual dataset contain more detailed information on the frequency of Internet use. The dataset was created by Island Research & Education Initiative (iREi) (2019) using information from the FSM census of population and housing (2010).